Spatial data models
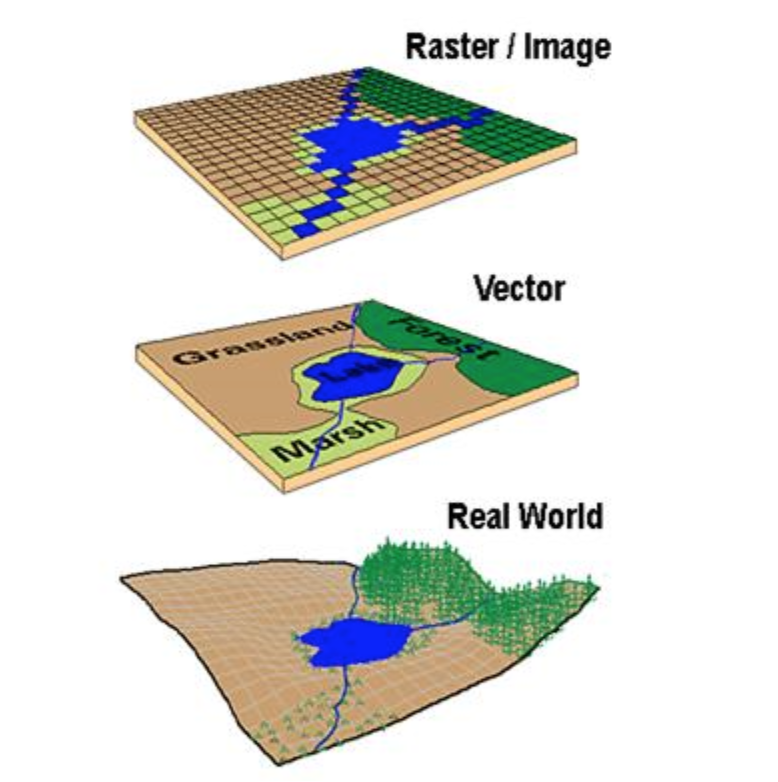
There are two main data models or conceptualizations used in GIS, the vector data model and the raster data model.
- Vector data model uses sets of coordinates and associated attribute data to define discrete objects. Features such as point, lines and polygons to represent the geometry of the real-world entities, discrete entities.
- Point objects in spatial database represent location of entities considered to have no dimension simplest type of spatial objects, e.g., wells, sampling points, poles, telephone towers, etc.
- Line objects are used to represent linear features using ordered set of coordinate pairs, e.g., infrastructure networks (transport networks: highways, railroads, etc.): utility networks: (gas, electric, telephone, water, etc.); airline networks: hubs and routes, etc.); natural networks such as river channels.
- Polygon objects in spatial database represent entities which covers an area, e.g., lakes, Buildings, parcels, etc.
- Raster data model defines the world as a regular set of cells in a uniform grid pattern, Cells are squares and evenly spaced in the x and y directions. Each cell represents attribute values and cell location of phenomena or entities. Raster data represents continuous phenomena that may change continuously across a region. E.g., elevation (DEM), rainfall, temperature, soil moisture, etc.
- Raster data model may also be used to represent discrete data e.g., land cover: forest, wetlands, urban areas.
- Rasters are normally digital aerial photographs, imagery from satellites, digital pictures, or even scanned maps.
Spatial data models begin with conceptualization, how you will represent the real-world phenomena or entities. E.g., a road can be represented as lines; river as line or polygon; city and towns as point or polygon, etc. the road to include the road type (e.g.: highway, street, etc. or gravel, paved/ asphalted, etc.); width of road.
Vector data model and Raster data model can represent the same phenomena, e.g., elevation represented as surface (continuous field) using raster grid or as lines representing contours of equal elevation (discrete objects), or as points of height (Z values)
Data can be converted from one conceptual view to another e.g., raster data layer can be derived from contour lines, point cloud.
Selection of raster or vector model depends on the application or type of operations to be performed e.g., Elevation represented as surface (continuous field) in raster – to easily determine slope, or as discrete contours if printed maps of topography.

What type of graphics do we use every day and what is the difference between them?
Source: Regents of University of California Davis
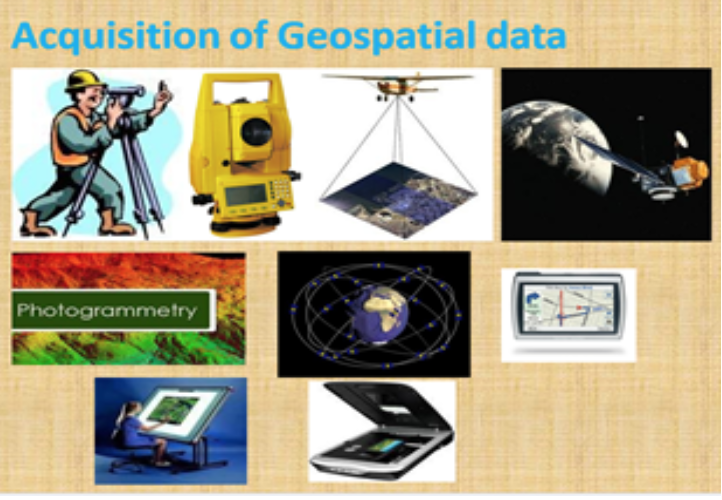
Acquisition of Geospatial Data

- Land survey (Field data collection – using Total station, EDM, GPS/DGPS receivers and Mobile Apps such as Kobo collect, survey 123, etc.)
- Photogrammetric process (use of Aircraft, UAVs and laser scanners)
- Scanned maps (Georeferencing & Digitization process)
- Remote sensing Data (Satellites image collection) can be found here:
- Copernicus global land services
- Earth Explorer from USGS
- Open Data Cube for Africa
- Digital Earth Africa (DE Africa) is providing analysis-ready data in Africa from free satellite imageries namely Landsat and Sentinel as well as continental services such as water observation from space, cloud-free mosaic (GEOMAD), fractional cover and cropland extent.
- If you want to find out more about remote sensing image collection, follow the links below:
- Copernicus global land services - https://land.copernicus.vgt.vito.be/PDF/portal/Application.html#Home
- Earth Explorer from USGS - https://earthexplorer.usgs.gov/
- Open Data Cube for Africa - https://www.opendatacube.org/
- Digital Earth Africa (DE Africa) - https://www.digitalearthafrica.org/platform-resources/services
Acquisition of Attribute data:
- Field investigations, Site Visits (use of questionnaires)
- Remote sensing image interpretation and processing
- Reports
- Thematic/Attribute data are generally collected by sampling method.
Note that the creation of attribute data and the link to non-spatial tabular data will be explored in detail in the next modules.
